How to Explore Your Data with GA4
With the introduction of GA4 Google added “Explorations”. This is one of the most powerful (and most intimidating) options in GA4 for diving into your data and surfacing new insights. When you first login and select “explore” from the navigation you’ll be greeted with several options ranging from “blank and freeform” all the way to “segment overlap and cohorts”, with all the choices even seasoned analysts will find it a little overwhelming. Given the power that is available however, we believe it’s worth the time and energy to jump in. Here are 3 fun reports that will help you surface new insights.
Pathing will answer “How are people getting to key resources?”
The path exploration report was available in Universal Analytics (the predecessor of GA4) but it was pretty cumbersome to use. Once you get the hang of in Explorations you’ll never want to turn back. This exploration allows you to see where people go from a specific starting point, or how they get to a specific ending point. This has an added layer of depth because it allows for the starting or ending point to be either a page or an event (ever wonder the full path a user takes to find and signup for your daily devotions? What about your donation form?). To get started all you need to do is select the “path exploration” template, it is populated with default data but you can select “start over” in the top right to clear the data and select your own starting or ending point.
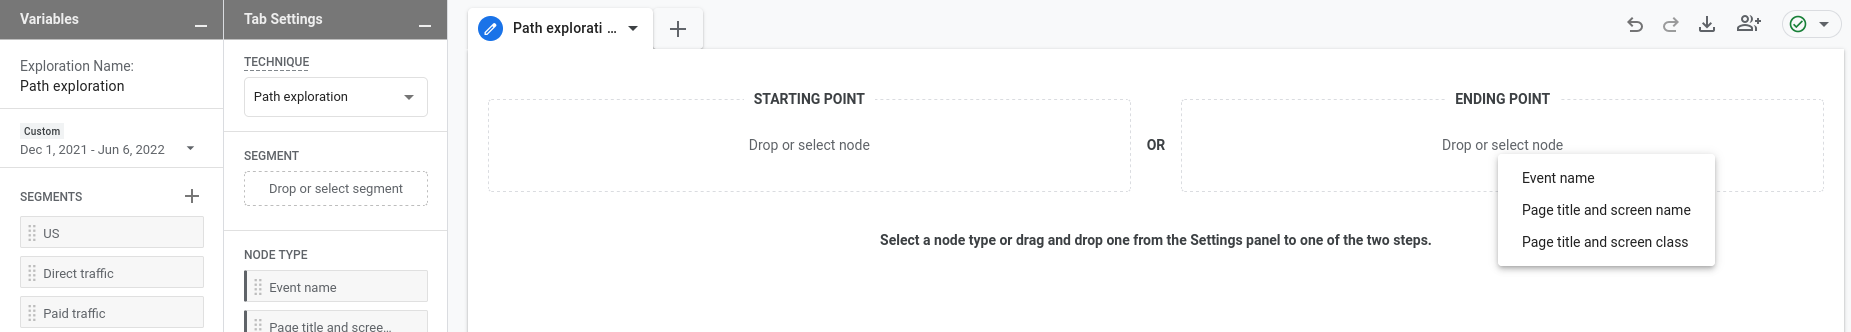
If you select event name, page title and screen name or page title and screen class it will provide you with a drop down list that includes all of the available options so you don’t have to know that ahead of time.
Questions to answer:
1. How are people signing up for your email list? This should be an event name end point.
2. How are people navigating to your donation page? This should be a Page title and screen name end point.
3. How are people finding your key ministry resources? This could be an event name or page title end point depending on the resource.
4. What are people doing once they find your key ministry resource? This could be an event name or page title starting point depending on the resource.
Funnel Exploration will help you see the progression of your user journeys
Funnel visualization is available in Universal Analytics but it does not have the flexibility offered in the GA4 Exploration. In the past this has generally been used for ecommerce analysis and optimization (where people are falling out of the checkout process), the new format however, makes it easier to see how people are progressing through a specific user journey. Like the path exploration, each step in the funnel can be either an event or visiting a specific page, this allows you to mix and match the type of actions within the journey.
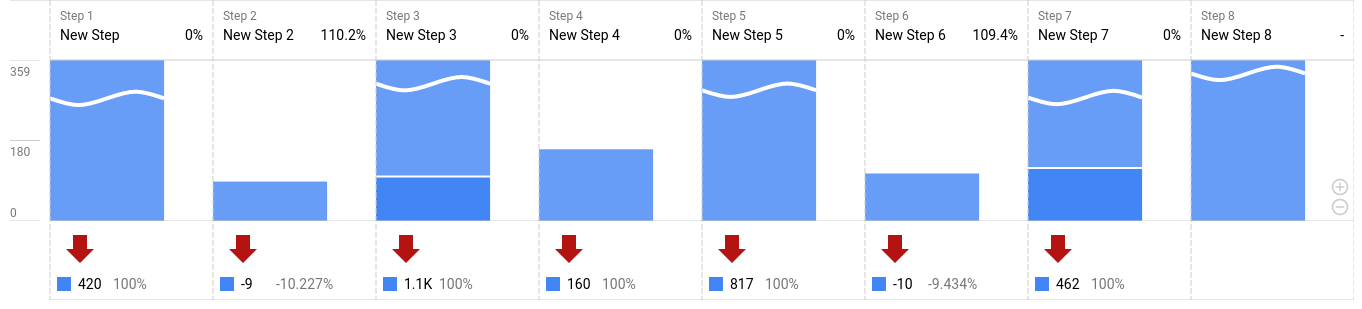
To set this up simply select the Funnel Exploration template. It will come pre populated with data, simply select the “start over” link in the top right corner, then begin adding your steps. Once all of your steps have been added and applied there are two additional options that are turned off by default but can add additional insights. The first is “Make Open Funnel” This allows you to see people who are skipping steps in the funnel and jumping in at different steps rather than going through the whole journey. This will not only give you insights into how users are progressing along the journey, but also where they are jumping into the journey. When you see steps where there are large portions of new users entering the funnel you can dig in deeper by exploring that step as an endpoint in the path report. The second setting which is turned off by default is “show time lapse” this one will have varied results based on the type of steps in your funnel but is worth testing.
Next steps with Funnel Exploration
1. Think beyond just conversions with your funnel, as people are consuming your content, what are the steps they should take to demonstrate they are growing their faith? Create a funnel using these pages and events as the steps.
2. When you expect people to take a specific action at a step and they are not, use that step as a starting point for a Path Exploration to see what actions the users are taking.
3. When a large number of people jump into your funnel at an unexpected step, use that step as an end point in the Path Exploration tool to see where those users are coming from.
Segment Overlap Exploration will allow you to see how different channels interact.
This exploration allows you to easily visualize how your segments interact with each other. Have you ever wondered how many of your users that first came to your website via social media, have also visited your site from organic search? What about how many of your users visiting your website from email are using a mobile device as opposed to a desktop computer? This exploration will help you visualize that and so much more.
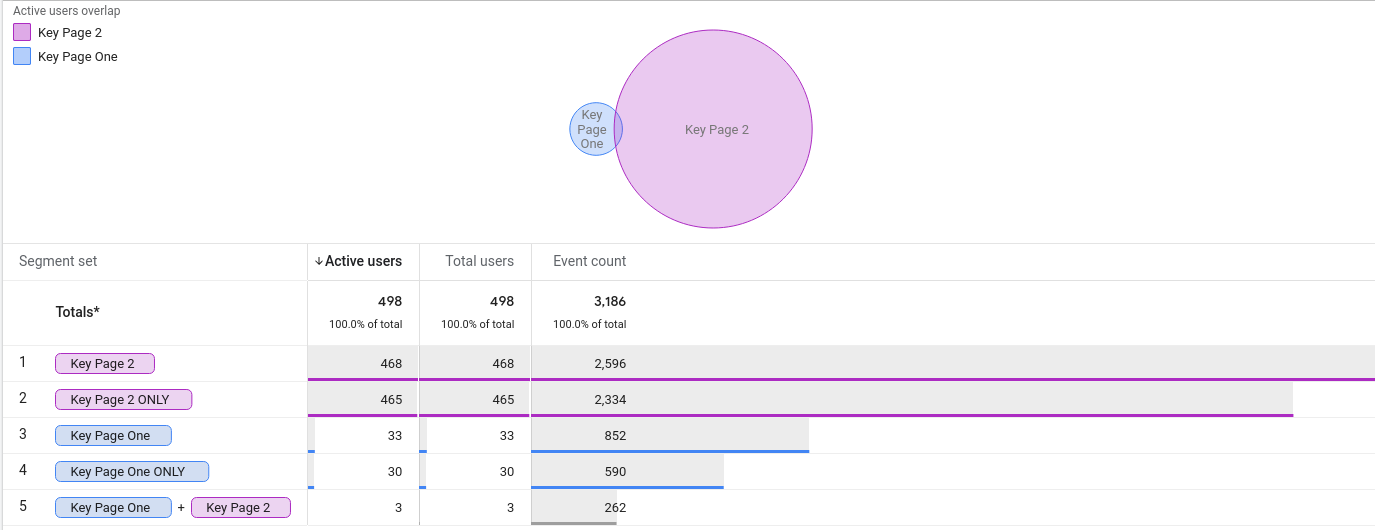
Since the possibilities here are pretty much endless, here are a few segments that are worth comparing to get started.
1. Campaign specific users that have return visits. To set this up you would create a segment for the campaign you are measuring (perhaps a specific offer you mentioned in a broadcast) by using “First Session Source” compared to users that have visited 2 or more times using a “Session Number” segment and setting the value to greater than or equal to 2. This will allow you to see if people who are drawn in by a specific offer get their freebie and bail or if they end up becoming engaged long term.
2. Overlap of Different Channels. Studies have shown that reaching people through multiple channels has a stronger impact than simply connecting through one channel. You can see what overlap there is between your marketing channels by creating a segment for each using the channel grouping segment (be sure to check the “at any time” box to ensure the segment applies to multiple visits and not just the current visit otherwise it will never overlap).
3. Key Steps Donors Take. You may have ideas as to what actions users take before they become donors, this will allow you to test out those theories. For example you could create a segment of email subscribers and compare it to your segment of donors. If there are a large number of donors that have never subscribed to your emails you might ask where they are getting the information that convinced them to give.
Let us know what your favorite explorations are. As you can see there is a lot of potential power available by exploring your data, so be sure to set aside some time this week to dig in.
Happy exploring!